Stock Market Prediction with Machine Learning
Lessons learned from publishing research on hybrid ML methods for predicting stock prices in emerging markets.

Table of contents
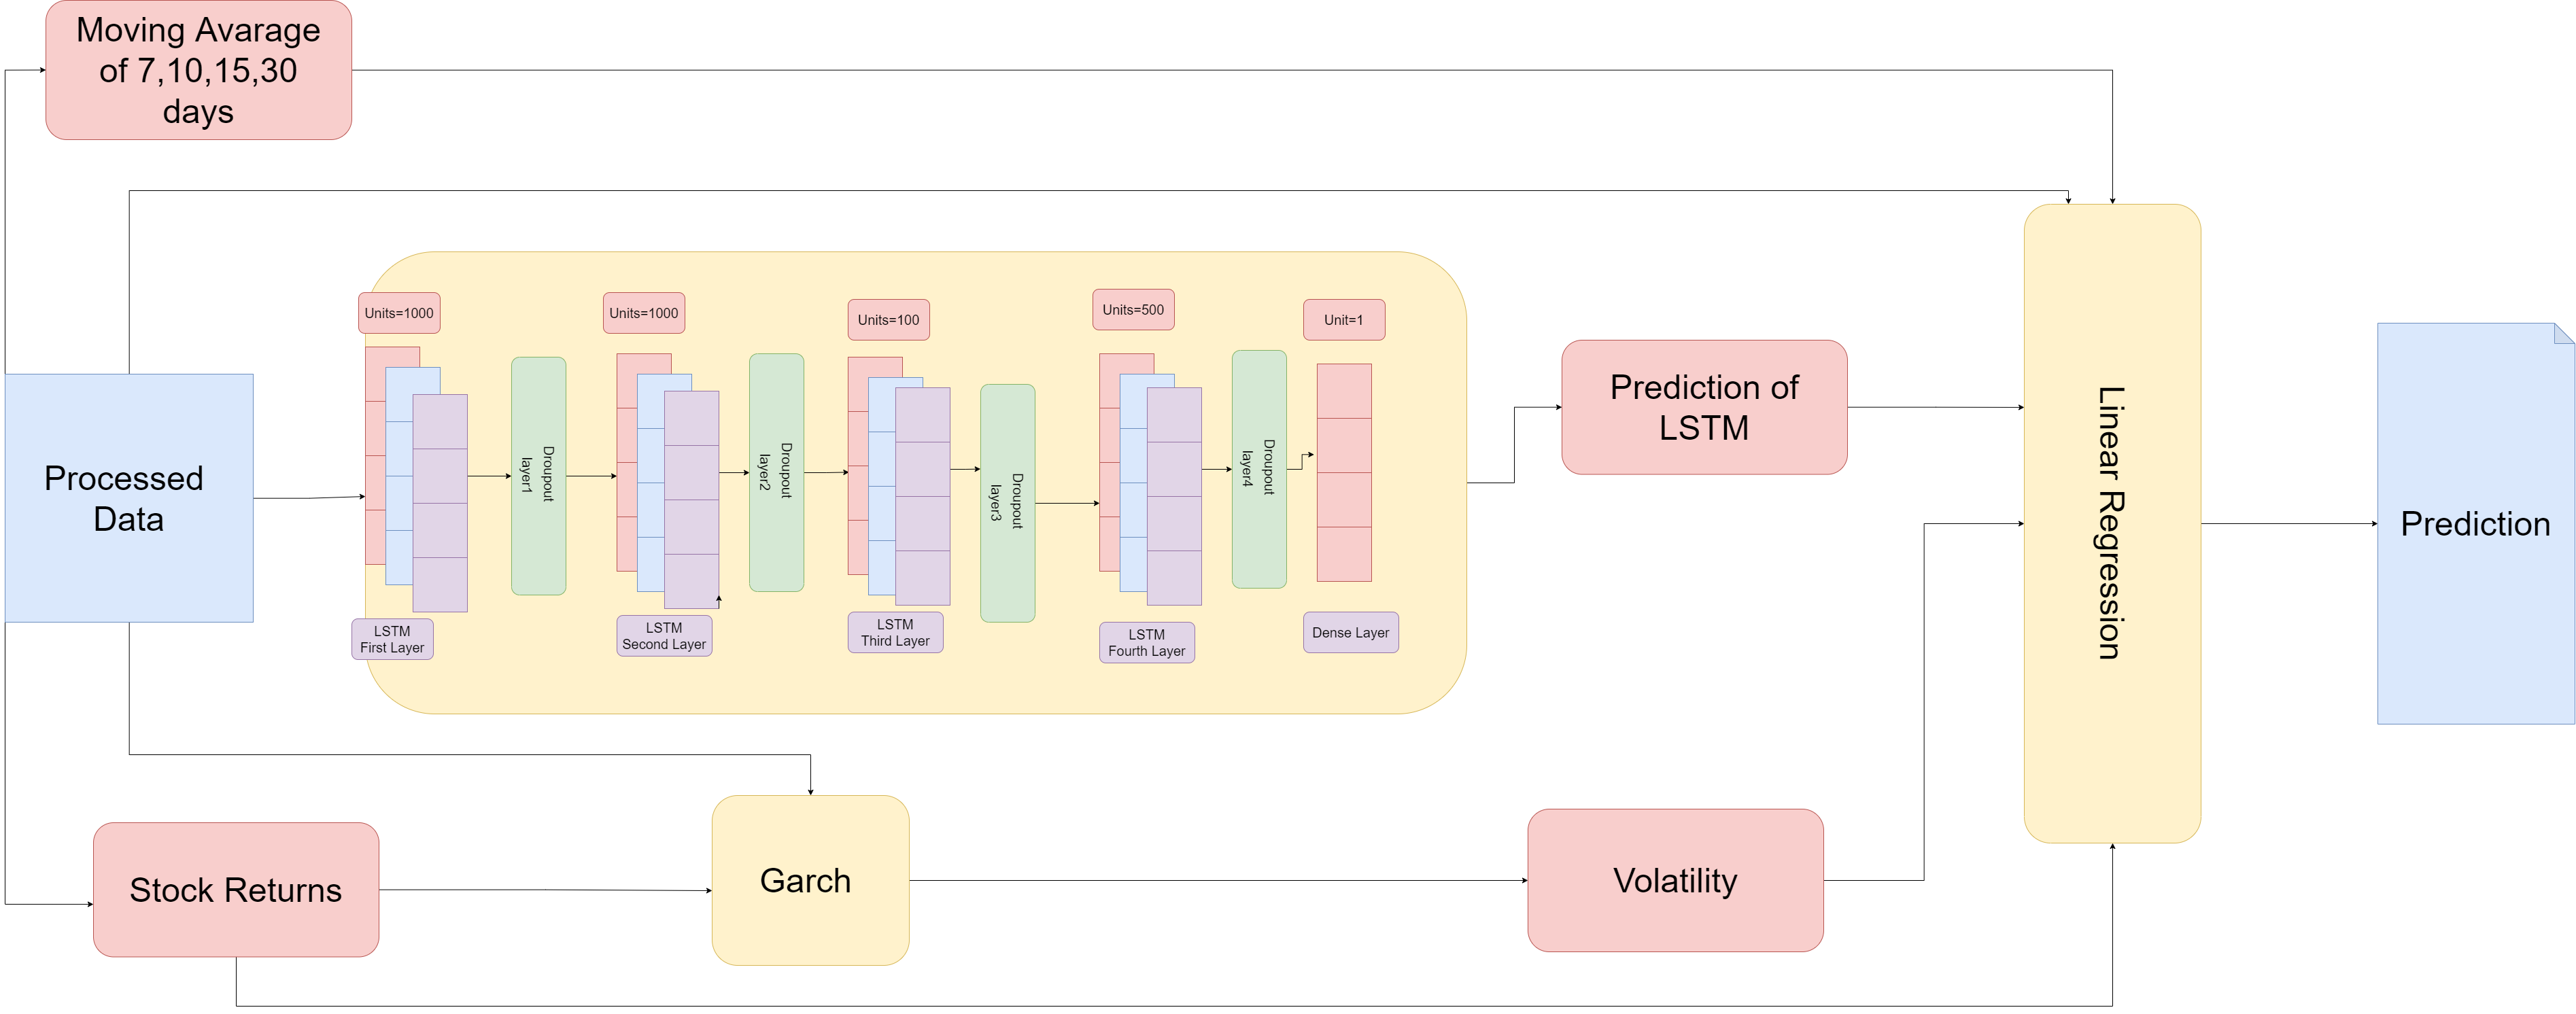
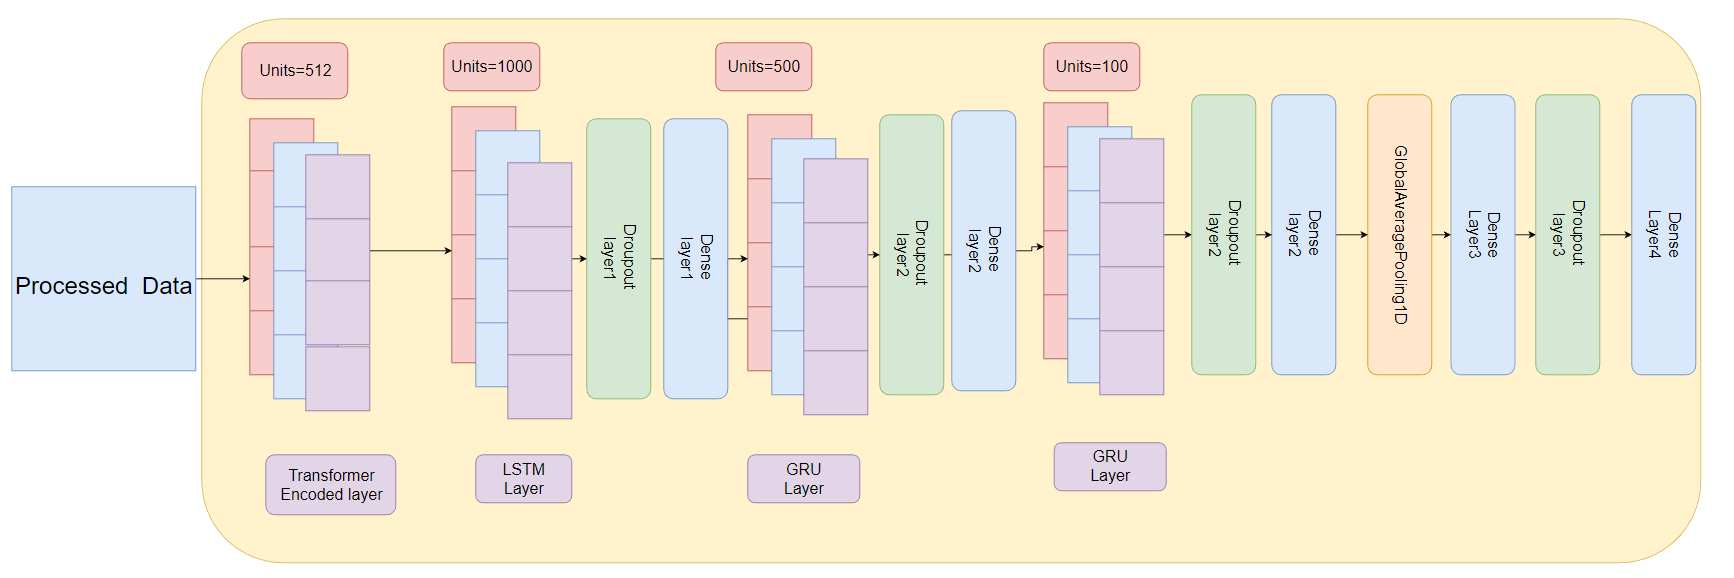
Between 2021 and 2023 I co-authored two papers on predicting prices on the Dhaka Stock Exchange (DSE). The first, published at IEEE IEMCON 2022, combined an LSTM, a GARCH volatility model and a linear regression. The second, DeepDse, published at IEEE CCWC 2023, stacked a Transformer with LSTM and GRU layers and added gold, silver, oil and US dollar prices as inputs. Each paper has its own detailed write-up on this blog. This post is about the things I learned along the way that don’t fit in a paper.
The data is the project
For a market like the DSE there was no clean dataset to download. We collected one CSV per trading day, 3,281 files covering 2007 to 2020, and merged them into just over a million rows. For DeepDse we extended that to almost two million rows through 2022 and lined commodity and currency prices up on the same dates. Missing days, renamed tickers, holidays and stocks that stopped trading all had to be handled before any model saw a number.
That work took longer than the modelling, and it mattered more. If you are starting research on an emerging market, budget most of your time for the dataset and treat it as a contribution in its own right.
Simple models are hard to beat
In the first paper the plain stacked LSTM was our weakest model, with a mean RMSE of 4.34 against 0.95 for linear regression. On Beximco, linear regression beat our own hybrid outright. That was humbling, and it was the right result to publish. Next-day prices change little from one day to the next, so a model that roughly copies today’s close already scores well, and a big network can easily do worse by overfitting noise.
The lesson I carry into every ML project now: always measure against the simplest possible baseline first. For prices that is "tomorrow equals today". If your model can’t clearly beat that, nothing else in the results table matters.
Combine models that see different things
The hybrid worked because its parts look at different signals: the LSTM at the sequence, GARCH at volatility, moving averages at trend. A linear regression on top learns how much to trust each one, and its coefficients tell you the answer. DeepDse applied the same idea inside one network, with attention for long-range patterns and recurrent layers for order, and it had the lowest error of every architecture we tried on all 11 stocks. Stacking two models that see the same thing rarely helps; stacking models with different views often does.
Careful with your numbers
Some mistakes are easy to make and hard to spot in a results table:
- Leakage. Fit the scaler on the training data only, and never shuffle a time series before splitting it. Otherwise the model sees the future during training and the test score is fiction.
- Units. Our first paper reports RMSE on prices, the second on scaled values between 0 and 1. Both are correct, but the numbers can’t be compared with each other, or with other papers that use different scaling. Say which one you report.
- One split isn’t enough. A single 80/20 split tests one stretch of market history. Walk-forward validation, retraining as the window moves, shows whether a model survives different market conditions.
- Error isn’t profit. A low RMSE doesn’t mean the model gets the direction of tomorrow’s move right, and direction is what a trading decision needs. Report directional accuracy too.
Writing it up
Writing the papers taught me as much as running the experiments. Explaining exactly how the GARCH order was picked, by fitting every (p, q) pair from 1 to 15 and keeping the lowest AIC, forced us to make sure we had actually done it carefully. Showing per-stock results instead of only an average kept us honest about where the model failed. Working as a team of six meant agreeing on one pipeline and one set of numbers, which is good practice for any engineering team too.
Report the stock where your model lost. A results table with no losses makes readers trust it less, not more.
What carried over to engineering
I now build AI agents and ERP automations rather than price models, but the habits are the same: build the data pipeline properly, measure against a simple baseline, combine components that each do one thing well, and be specific about what your numbers mean. Those habits are what this research gave me.

Written by Omor Al Tanim
Newsletter
Enjoyed this? Get the next one by email
A short email when I publish something new on AI agents, ERP automation or research. No spam; unsubscribe in one click.
More from Omor Al Tanim
 In Research by Omor Al TanimSep 28, 2026Pinned
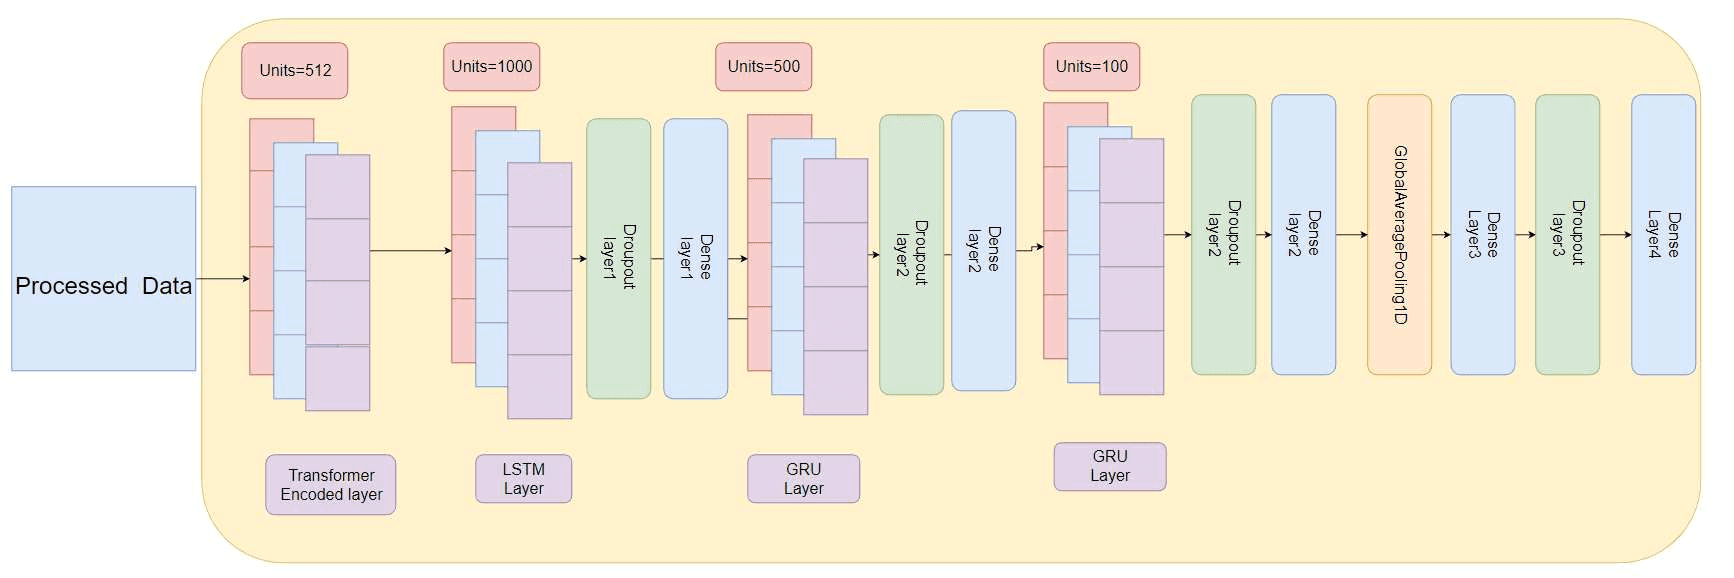
DeepDse: Predicting the Dhaka Stock Exchange with Transformers, LSTMs and GRUs
How we combined a Transformer encoder with LSTM and GRU layers, added gold, oil and USD prices as inputs, and got the lowest error on all 11 DSE stocks we tested.
- In Research by Omor Al TanimSep 28, 2026
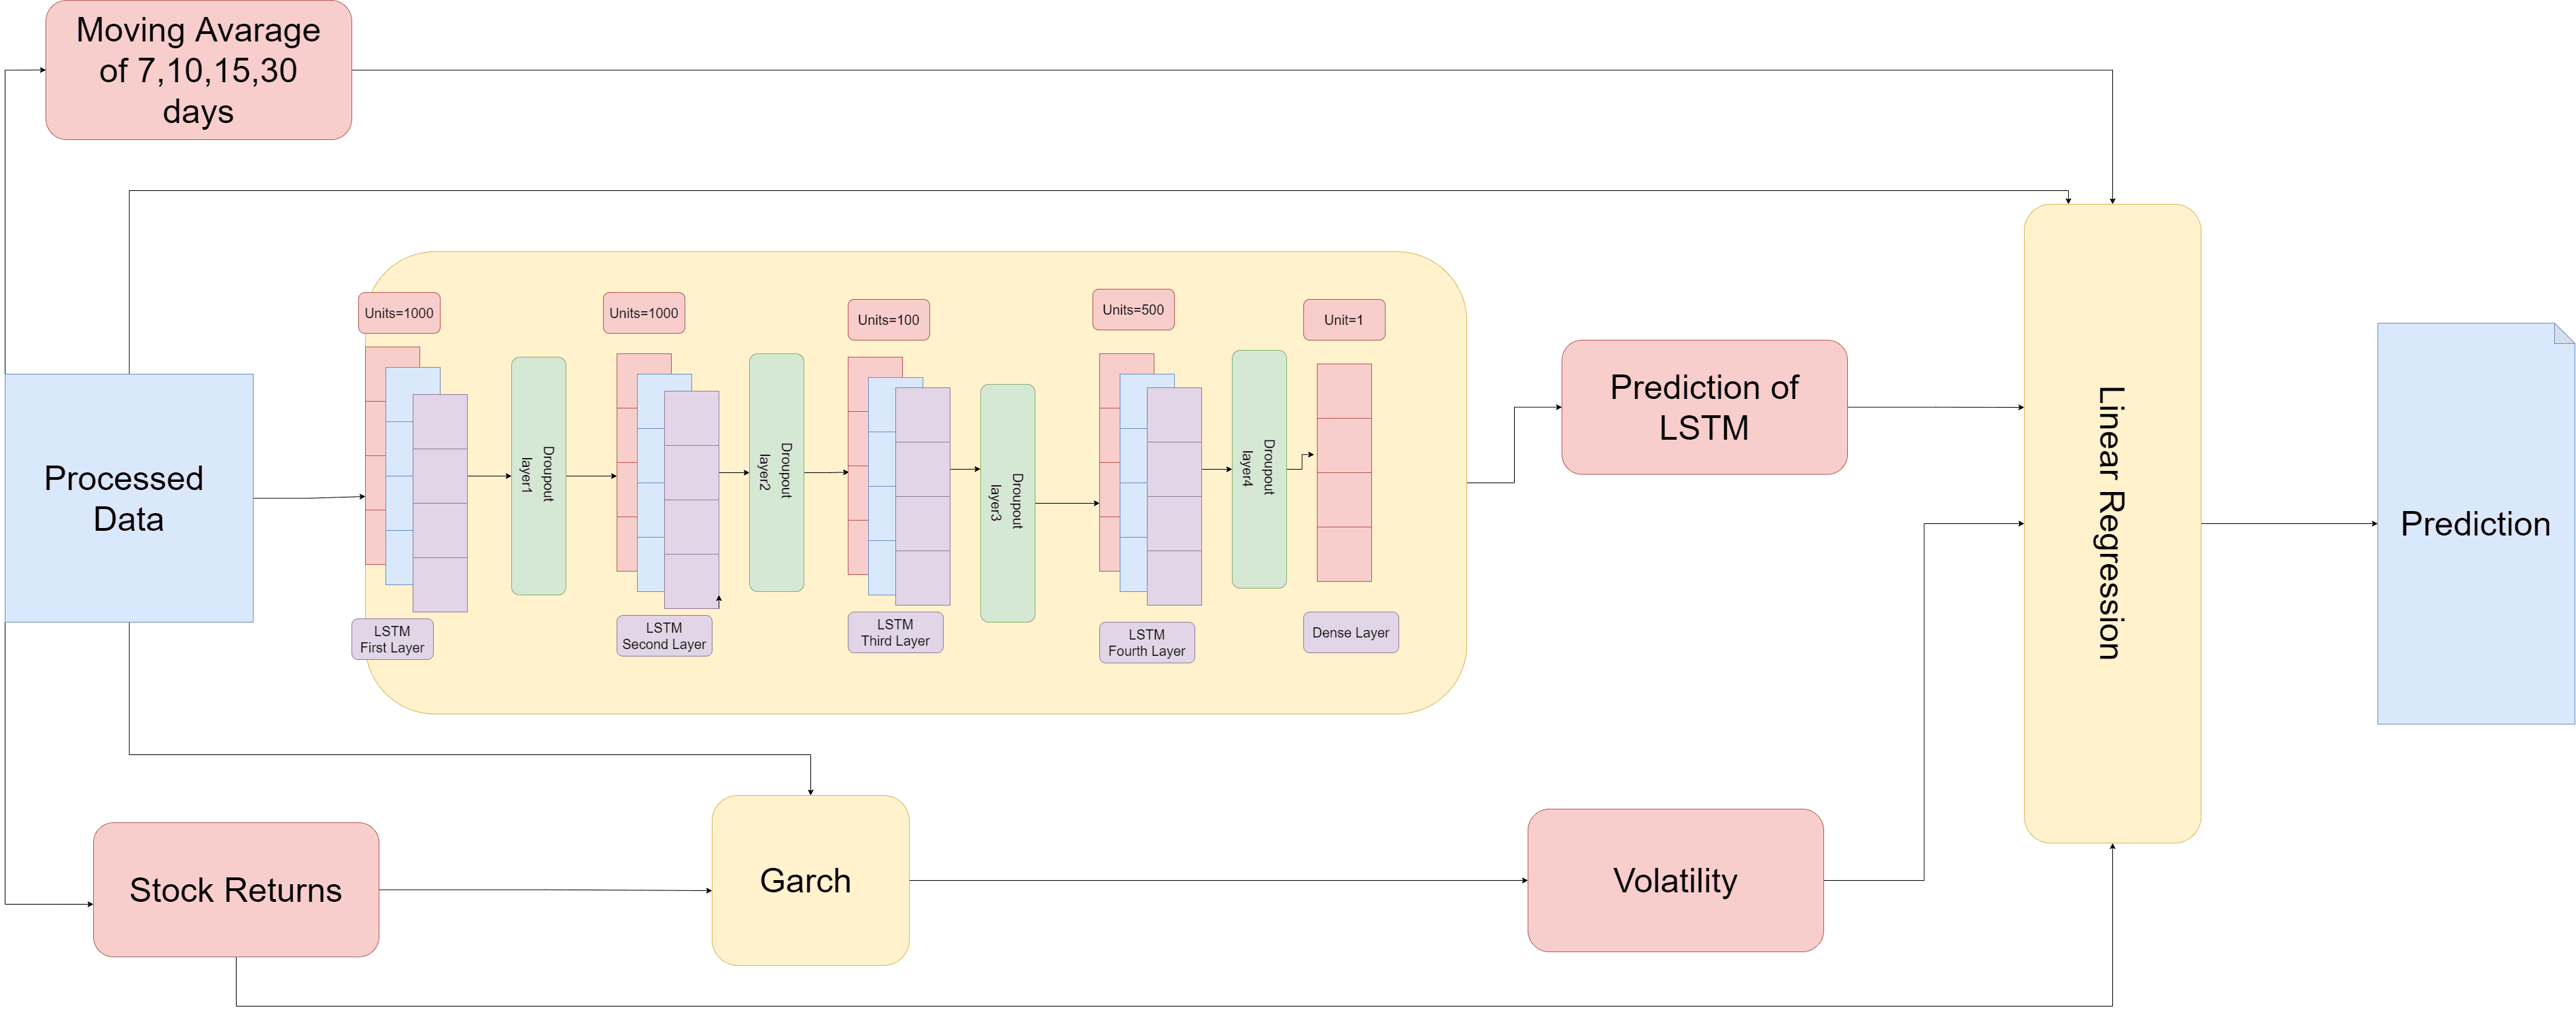
LSTM + GARCH + Regression: A Hybrid Model for Bangladesh’s Stock Market
Why we split stock prediction across three models (a stacked LSTM for price, GARCH for volatility, and a linear regression to combine them) and how that roughly halved the error.
- In AI/ML by Omor Al TanimJan 15, 2025
Building Multi-Agent Systems with Semantic Kernel
A deep dive into creating intelligent multi-agent systems using Microsoft Semantic Kernel for orchestrating complex AI workflows.
Comments (0)
Comments are checked by AI before they appear. Read the rules
Loading comments…